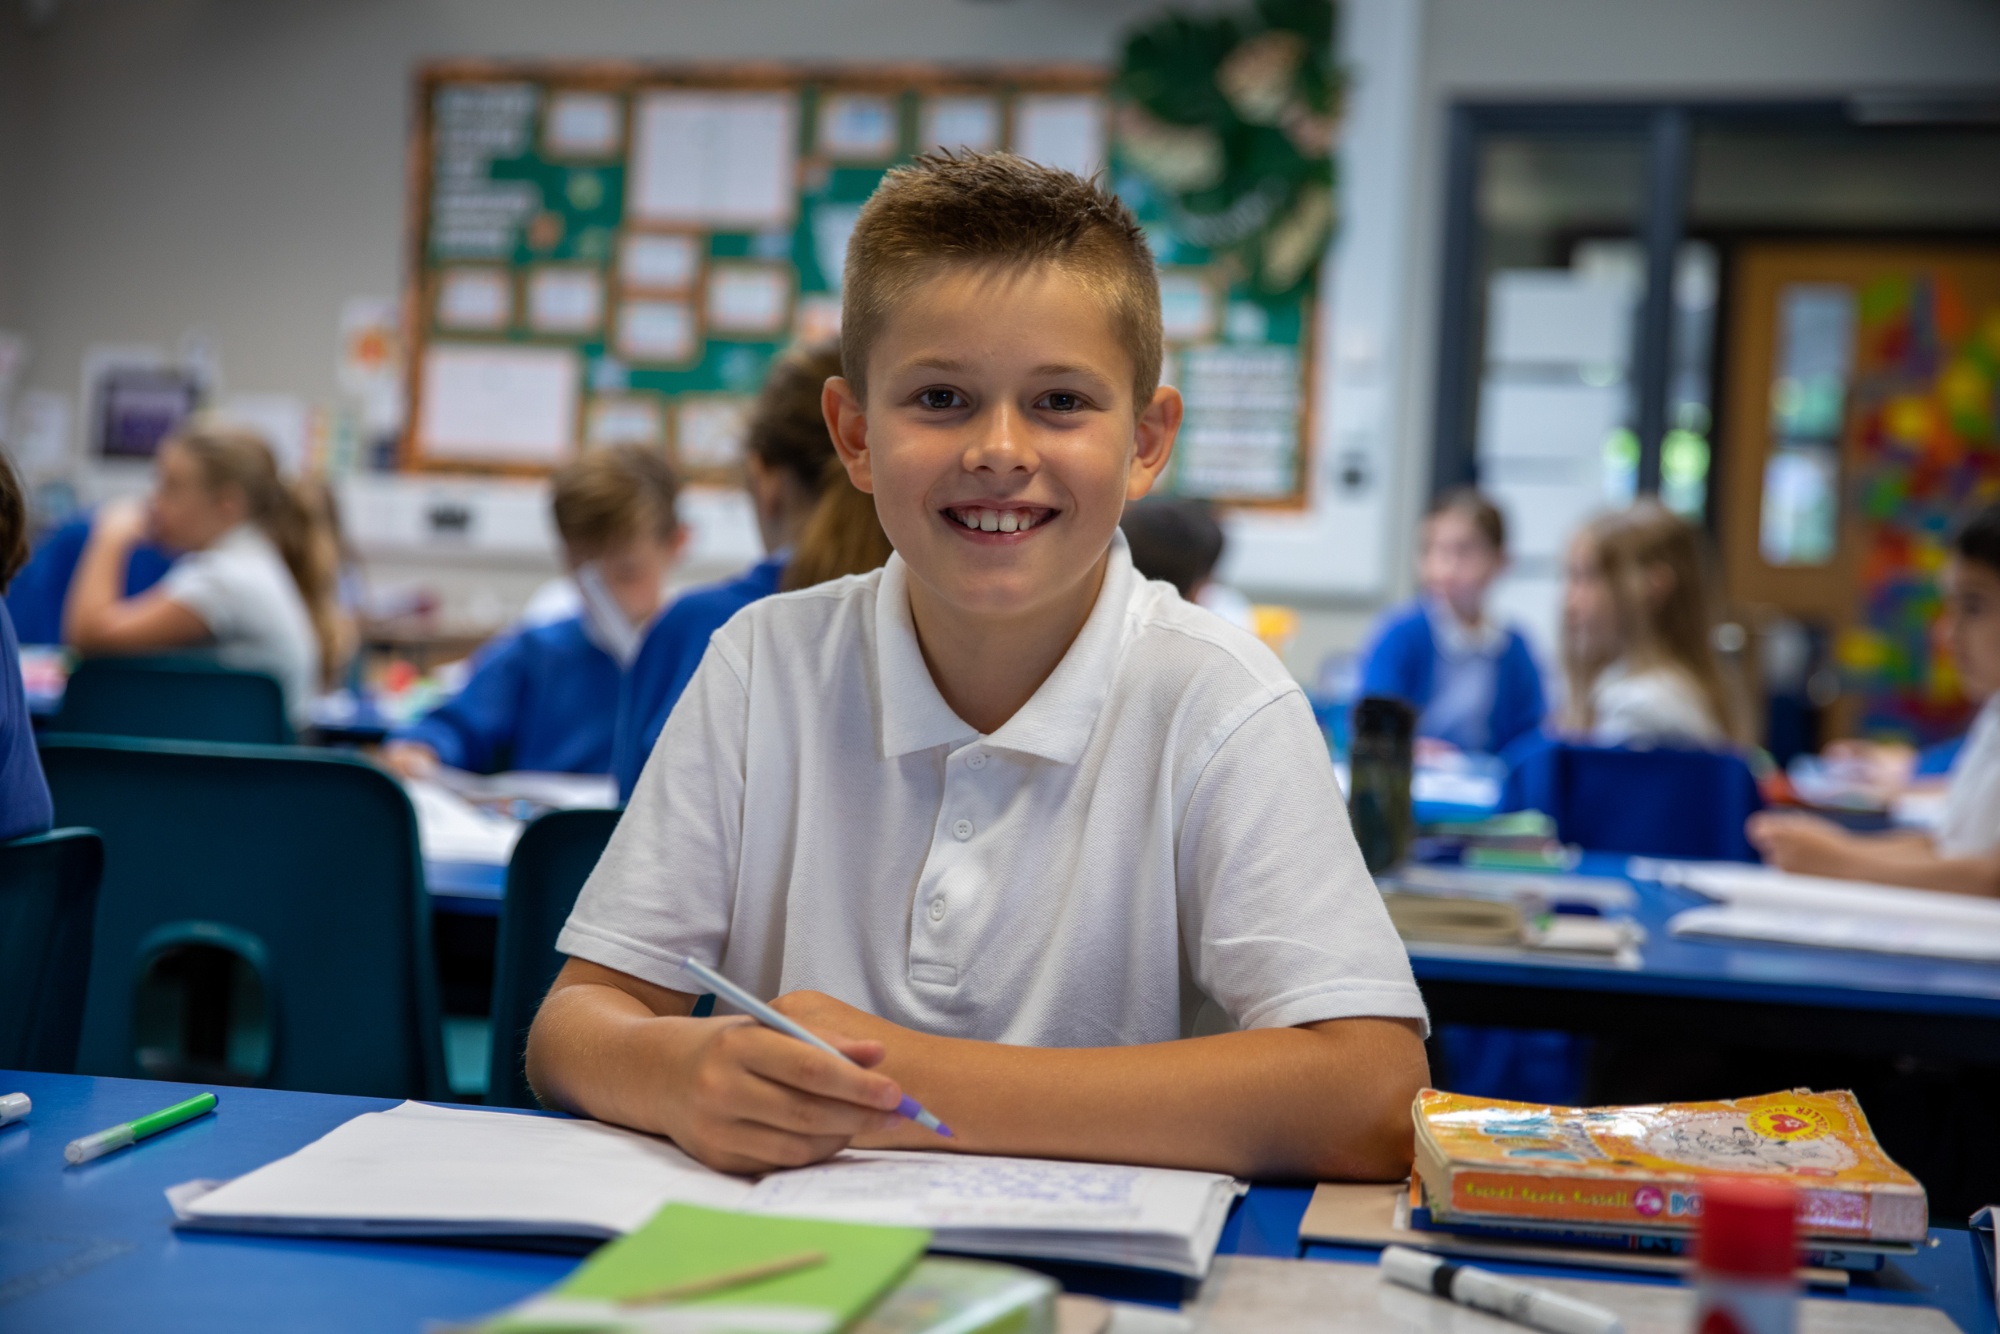
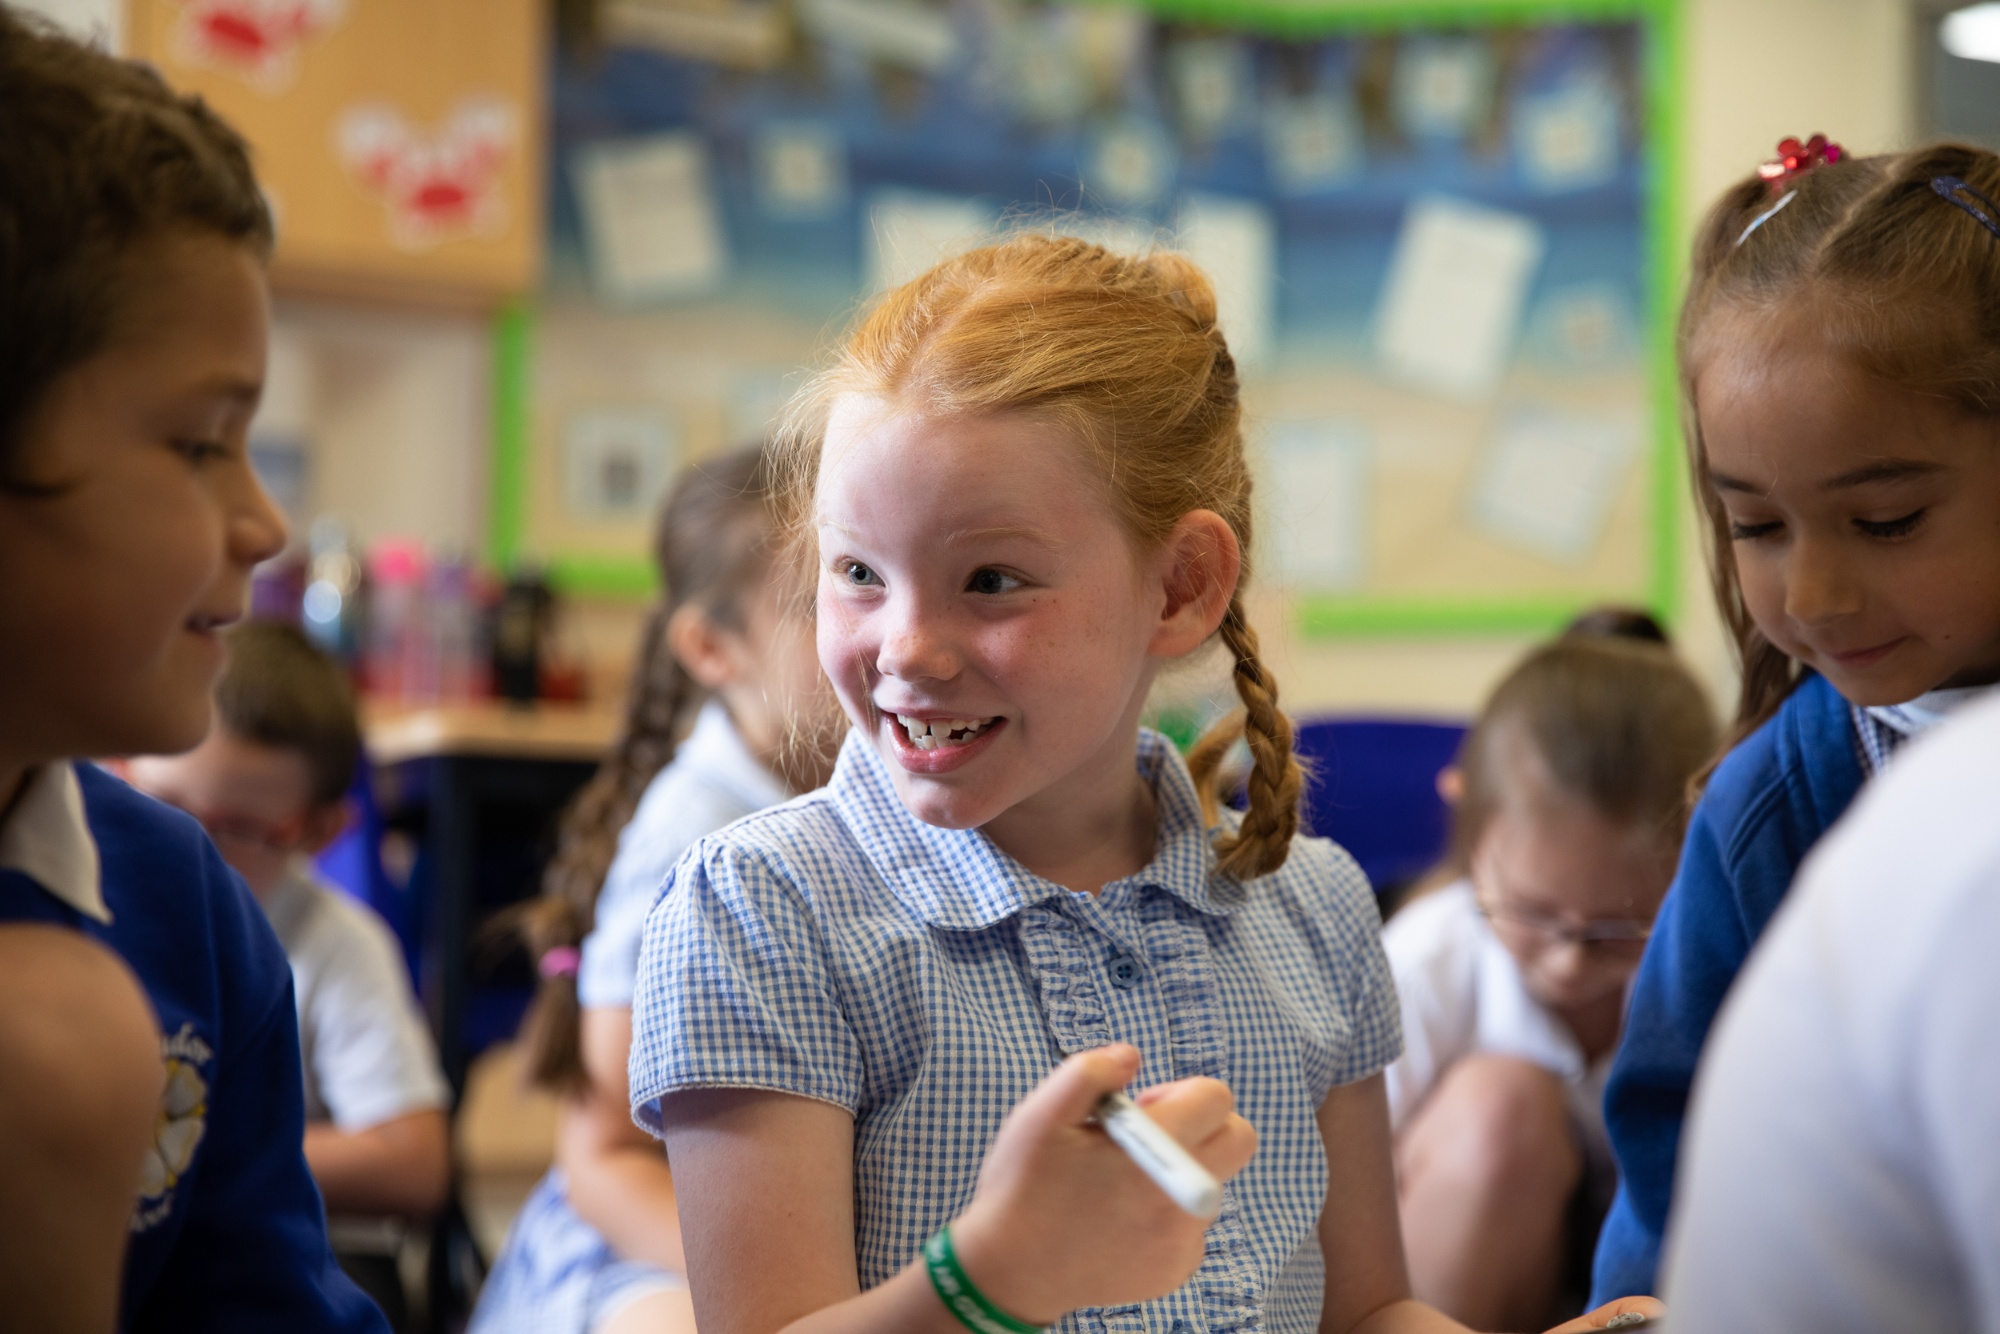
Raising the bar at Tudor Primary- making our vision a reality…
'Enabling Dreams, Inspiring Minds, Building Futures'
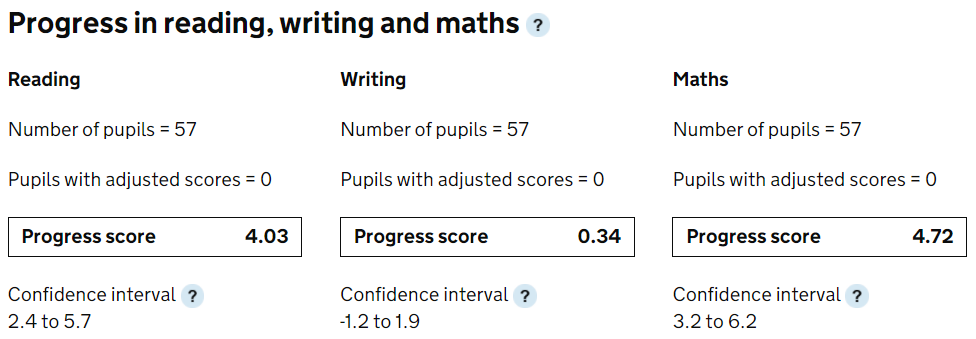
Our results continue to demonstrate how Tudor Primary is a school that has high aspirations in respect of outcomes for attainment and progress. We are able to share strong progress scores in all key curriculum areas. The first Ofsted inspection for the current leadership team in March 2017 highlighted how outcomes needed to improve for the children-we are delighted to EVIDENCE the transformation in this key indicator since that inspection and how children at Tudor truly can EXCEL in the curriculum.
'There is a culture of aspiration in the school. Adults set high expectations and pupils try hard to meet them. A Year 6 pupil said, ‘You always want to be at your highest level.’ (Ofsted, December 2022)
We are very proud of the (sustained) achievements of our children since 2016 as they now evidence the high impact of all the work that the Tudor Teaching Team put in. We have even achieved progress scores that put Tudor Primary in the top bracket of all schools nationally. Well done all!
Additional assessment information is available at:
https://www.compare-school-performance.service.gov.uk/school/117109/tudor-primary-school
Whilst not related to assessment results, you can use the following link to compare our 'financial performance' with other schools too:
https://schools-financial-benchmarking.service.gov.uk/School?urn=117109
Results by key stage (over time):
Key Stage 2
2024 Outcomes in Key Stage 2
|
Reading |
Writing |
Maths
|
Grammar, Punctuation & Spelling |
Reading, Writing and Maths Combined |
||||||
|
School 2024 |
National 2024 |
School 2024 |
National 2024 |
School 2024 |
National 2024 |
School 2024 |
National 2024 |
School 2024 |
National 2024 |
|
|
% Attainment at Expected/ above |
86 | 74 | 83 | 71 | 78 | 73 | 85 | 72 | 75 | 61 |
|
% Attainment at Higher Level |
37 | 29 | 27 | 13 | 31 | 24 | 49 | 32 | 14 | 8 |
2023 Outcomes in Key Stage 2
|
Reading |
Writing |
Maths
|
Grammar, Punctuation & Spelling |
Reading, Writing and Maths Combined |
||||||
|
School 2023 |
National 2023 |
School 2023 |
National 2023 |
School 2023 |
National 2023 |
School 2023 |
National 2023 |
School 2023 |
National 2023 |
|
|
% Attainment at Expected/ above |
72 | 73 | 67 | 72 | 70 | 73 | 80 | 72 | 60 | 60 |
|
% Attainment at Higher Level |
27 | 29 | 25 | 13 | 23 | 24 | 43 | 30 | 13 | 8 |
Science (TA) for 2023= 79% (National = 79%)
2022 Outcomes in Key Stage 2
|
Reading |
Writing |
Maths
|
Grammar, Punctuation & Spelling |
Reading, Writing and Maths Combined |
||||||
|
School 2022 |
National 2022 |
School 2022 |
National 2022 |
School 2022 |
National 2022 |
School 2022 |
National 2022 |
School 2022 |
National 2022 |
|
|
% Attainment at Expected/ above |
83% |
74% |
67% |
69% |
84% |
71% |
83% |
72% |
62% |
59% |
|
% Attainment at Higher Level |
38% |
28% |
10% |
13% |
36% |
22% |
52% |
28% |
10% |
7% |
Science (TA) for 2022= 79% (National = 79%)
2019 Outcomes in Key Stage 2
|
Reading |
Writing |
Maths
|
Grammar, Punctuation & Spelling |
Reading, Writing and Maths Combined |
||||||
|
School 2019 |
National 2019 |
School 2019 |
National 2019 |
School 2019 |
National 2019 |
School 2019 |
National 2019 |
School 2019 |
National 2019 |
|
|
% Attainment at Expected/ above |
72% |
73% |
74% |
79% |
81% |
76% |
83% |
78% |
61% |
65% |
|
% Attainment at Higher Level |
25% |
27% |
19% |
20% |
21% |
27% |
54% |
36% |
14% |
11% |
2018 Outcomes in Key Stage 2
|
Reading |
Writing |
Maths
|
Grammar, Punctuation & Spelling |
Reading, Writing and Maths Combined |
||||||
|
School 2018 |
National 2018 |
School 2018 |
National 2018 |
School 2018 |
National 2018 |
School 2018 |
National 2018 |
School 2018 |
National 2018 |
|
|
% Attainment at Expected/ above |
80% |
75% |
76% |
78% |
83% |
76% |
87% |
78% |
69% |
64% |
|
% Attainment at Higher Level |
32% |
28% |
11% |
20% |
32% |
24% |
41% |
34% |
6% |
10% |
2017 Outcomes in Key Stage 2
|
Reading |
Writing |
Maths
|
Grammar, Punctuation & Spelling |
Reading, Writing and Maths Combined |
||||||
|
School 2017 |
National 2017 |
School 2017 |
National 2017 |
School 2017 |
National 2017 |
School 2017 |
National 2017 |
School 2017 |
National 2017 |
|
|
% Attainment at Expected/above |
73% |
72% |
76% |
77% |
76% |
75% |
79% |
77% |
69% |
64% |
|
% Attainment at Higher Level |
38% |
25% |
13% |
13% |
38% |
23% |
41% |
34% |
6% |
7% |
2016 Outcomes in Key Stage 2
|
Reading |
Writing |
Maths
|
Grammar, Punctuation & Spelling |
Reading, Writing and Maths Combined |
||||||
|
School 2016 |
National 2016 |
School 2016 |
National 2016 |
School 2016 |
National 2016 |
School 2016 |
National 2016 |
School 2016 |
National 2016 |
|
|
% Attainment at Expected/ above |
50% |
66% |
77% |
74% |
57% |
70% |
73% |
73% |
43% |
53% |
Other key assessment areas:
Year 1 Phonics Screening Check
Children in Year 1 are required to have a phonics screening check. Our results have improved dramatically in the recent past and we have even achieved ‘aspirational targets’ set by county advisors. The school has undergone a complete transformation of approach in the teaching of phonics in the recent past and we are delighted with our sustained improvement!
|
Phonics Screening Check |
2017 |
2018 |
2019 | 2020 | 2021 | 2022 | 2023 | 2024 | 2025 |
|
School |
School |
School | School* | School* | School | School | School | School | |
|
% Y1 achieving expected standard *2020 and 2021 taken in Yr2 Aut 2 |
63% |
75% |
76% | 85% | 78% |
83% |
75% | 83% | 86% |
National percentage for children passing the year 1 phonics check in 2023 was 79%.
Year 4 Multiplication Check
In 2022, Tudor Primary performed very well in the first ever national completion of the year 4 timetable check. As you can see, 50% of our children got full marks which was 25 out of 25. The average score for all children was 22.4. The success has continued:
| Year | 2022 | 2023 | 2024 | 2025 |
| Average score out of 25 | 22.4 | 21.7 | 21.7 | 22.4 |
| % of children getting 100% (25/25) | 50% | 38% | 43% | 50% |
National comparison- 2022 national average score was 19.8 with 27% getting 25/25.
Key Stage 1 Outcomes
2023 Outcomes in Key Stage 1
|
% of Children Achieving |
Reading |
Writing |
Maths |
|
School 2023 |
School 2023 |
School 2023 | |
|
Attainment at Expected |
70% |
63% |
70% |
|
Attainment at Greater Depth |
12% |
2% |
15% |
2022 Outcomes in Key Stage 1
|
% of Children Achieving |
Reading |
Writing |
Maths |
|
School 2022 |
School 2022 |
School 2022 | |
|
Attainment at Expected |
64% |
60% |
66% |
|
Attainment at Greater Depth |
21% |
9% |
17% |
2017/2018/2019 Outcomes in Key Stage 1
|
% of Children Achieving |
|
|
|
||||||
|
School 2017 |
School 2018 |
School 2019 |
School 2017 |
School 2018 |
School 2019 |
School 2017 |
School 2018 |
School 2019 |
|
|
Attainment at Expected |
59% |
65% |
67% |
46% |
65% |
62% |
54% |
70% |
67% |
|
Attainment at Greater Depth |
14% |
13% |
10% |
7% |
13% |
8% |
2% |
17% |
15% |
EYFS Outcomes
The Early Years and Foundation Stage has been an area of high focus at Tudor over the past few years. In addition to major investment in the learning spaces (both inside and out), we have transformed the approaches to teaching and learning. We are very proud of the impact that has been made in this vital area of the school.
Our recent 'outcomes' include the highest levels of attainment we have ever had in the EYFS, phonics and more! It must be noted, though, that results in the 2020/2021 period are not 'official' due to assessment procedures not being statutory at a national level.
|
GLD Outcomes |
2017 |
2018 |
2019 | 2022 | 2023 | 2024 |
|
% of children to achieve level |
51% |
63% |
68% | 65% | 68% | __% |
National comparison- 2022 national % was 65%